Rolling-baseline ODI-4 systematically under-estimates the apnea–hypopnea index in severe sleep apnea: a quantified bias, its mechanism, and a detector-level correction
The generator now plants desaturations that respect the physiological
fall-rate limit (synth-gen.js, rate-limited to 1.0 %/s; the caps are measured from 36
real nights of 1 Hz SpO₂ and 342 events carrying onsetTMs — onset→nadir p50 7 s,
depth p50 5 %, implied 0.714 %/s, with only 0.20 % of real one-second falls
exceeding the 1.5 %/s ceiling). Re-running §6's recipe on the repaired corpus, with the detector
unchanged:
| planted AHI | 3 | 4 | 7 | 22 | 38 | slope | R² |
|---|---|---|---|---|---|---|---|
| ODI-4, square-edged fixture | 0.8 | 0.5 | 1.5 | 5.6 | 1.4 | 0.051 | 0.137 |
| ODI-4, physiological fixture | 0.8 | 0.9 | 2.4 | 17.7 | 33.1 | 0.946 | 0.997 |
The under-count deficit goes from 2.2 → 3.5 → 5.5 → 16.4 → 36.6
events/h across the severity range — the severity gradient this paper reports — to a roughly
constant 2.2–4.9. OxyDex finds the same 242 desaturations on night 2 in both cases;
the difference is entirely that selfGateDesat rejected 232 of them as probe
artifact from the old fixture and none from the repaired one. The severity-dependent
under-count was the artifact gate correctly discarding an unphysiological oracle. A residual
~3–5 events/h remains, which is the ordinary consequence of not every scored apnea producing a
≥4 % desaturation — it carries no severity gradient and does not support a detector-level bias.
What this does and does not settle. It settles that on any
corpus this repository can produce today, the headline result is not reproducible and its
apparent mechanism is a fixture defect. It does not establish that the original 2026-06 corpus —
gitignored and gone — had the same defect, and it does not prove the trailing-mean
baseline-self-suppression mechanism in the green note below is unreal; that mechanism is simply no
longer evidenced here. Every number below the fold remains unverified. Regression-gated in
tests/dex-tests.js (synth-gen plants desaturations that can pass OxyDex's own
artifact gate), which renders the nights in-realm each run rather than pinning 3.7 MB of
gitignored bytes.
The original 1 August status, retained:
Three findings, in order of how much they matter:
- §6's recipe was broken.
odi-bias-analysis.jsreached OxyDex'sparseCSV/processNightas bare globals, which stopped existing whenoxydex-dsp's back-compat spray was removed. Both call sites sit insidetry/catch, so the failure read as "this night had no usable data" and the page populated an empty table, silently. Fixed 2026-07-31; the recipe runs again. - Table 1 no longer reproduces, and the cause is the INPUTS, not the detector. Running the
repository's earliest committed detector (2026-07-01) against today's corpus reproduces today's
numbers exactly, so the detector has not drifted. The five
uploads/synthetic/recordings are gitignored — they were never a pinned artifact — so the corpus Table 1 was computed from no longer exists and cannot be recovered. - On the corpus that exists today, the reported under-count is an artifact of the fixture.
The synthetic desaturations fall at up to 4 %/s, and 16–32 % of one-second falls on the
two severe nights exceed the 1.5 %/s physiological ceiling that
selfGateDesatuses to separate a systemic desaturation from a probe squeeze. The detector therefore rejects 232 of 242 events on night 2 and 92 of 135 on night 1 as artifact — correctly. Because the generator plants more events on severe nights, the rejection scales with severity, which reproduces the severity-dependent deficit this paper reports as its central finding without any detector bias being present. Measure it yourself:node tools/synth-desat-kinetics.mjs uploads/synthetic/.
What is NOT claimed. The original numbers are not asserted to be
wrong — they were computed when the recipe worked, from a corpus that is gone. Whether that corpus had
the same kinetics defect is unknown and, without it, unknowable. The baseline-self-suppression
mechanism described in the green note below may well be real; what is established is only that
this pilot no longer demonstrates it. Resolution requires fixing the generator's desaturation
morphology, pinning the corpus as a content-addressed fixture like every other known-answer in this
repository, and re-running — tracked in
briefs/PAPER-ODI4-REPRODUCIBILITY-2026-07-31-BRIEF.md and
briefs/SYNTH-GEN-DESAT-KINETICS-2026-08-01-BRIEF.md. Until then, treat every number
below as unverified.
baseline−4% threshold sinks and later events of equal depth are no longer counted. Replacing the trailing mean with a trailing high-percentile (p90) "ceiling" baseline (computeCeilingBaselineArr in oxydex-util.js; wired into detectODI) restores the resting-SpO₂ reference a desaturation is defined against. On the v1.6 synthetic cohort the severe-stratum mean bias roughly halves (≈−31 → ≈−16 events·h⁻¹) and the severity gradient flattens, without inflating the non-apneic stratum. The residual under-count is smaller but non-zero (the detector still recovers <100% of scored events), so the ODI-4 × 1.1 AHI surrogate was re-examined and retained (it does not over-shoot). Original characterization preserved below; corrected numbers are marked (fixed).OxyDex oximetry-analysis node, Tepna physiological-signal suite
Abstract
Background. Consumer and clinical pulse-oximeters summarize overnight hypoxemia with the oxygen-desaturation index (ODI), commonly the 4%-desaturation variant (ODI-4), and frequently report a surrogate apnea–hypopnea index (AHI) as AHI ≈ ODI-4 × 1.1. We test whether that surrogate holds. Methods. We ran the production OxyDex ODI-4 detector on overnight SpO₂ recordings and compared ODI-4 against a reference AHI. Results. Across the pilot corpus ODI-4 tracked AHI strongly but with a slope of ≈0.23 (R²≈0.93) — recovering only about one quarter of scored respiratory events — and the deficit grew with severity (mean under-count ≈30 events/h in the severe stratum). The shipped ×1.1 surrogate gave a leave-one-out RMSE of 15.2 events/h; a re-fit linear correction roughly halved it to 7.2. Replication on clinical PSG. The same detector was run unchanged over the full SHHS1 cohort (n = 5136 expert-scored polysomnograms). Against those cohorts’ scored AHI the slope is 0.134 (R² 0.27) — but that reference counts hypopneas scored without any accompanying desaturation (85.3 % of its respiratory events are hypopneas; a median 66.7 % of its scored desaturations are shallower than 3 %), so a 4 %-threshold index cannot count them and the gap is definitional before it is behavioural. Against the expert’s own desaturation index — the same quantity the detector computes, on the same nights — the slope is 0.672 (R² 0.756, n = 4932), with a median difference of −0.22 events/h. The synthetic prediction therefore transfers: the ceiling-baseline fix was credited below with lifting the slope to ≈0.69 on the synthetic cohort, and real PSG returns 0.672 once the reference is matched. Conclusion. The under-count is a deterministic detector artifact, not noise. (fixed) Tracing it to trailing-mean baseline self-suppression and replacing the mean with a high-percentile ceiling baseline roughly halves the severe-stratum bias (≈−31 → ≈−16 events·h⁻¹ on the synthetic cohort) and lifts the ODI-4↔AHI slope from ≈0.42 to ≈0.69 — a detector-level fix that needs no new sensing and no recalibration constant. This pilot is small (n=5 nights with planted/ specified reference AHI) and not PSG-scored — it characterizes and motivates rather than establishes the clinical result.
Keywords: oximetry · oxygen desaturation index · apnea–hypopnea index · obstructive sleep apnea · calibration · consumer wearables
0. Layman overview (delete before submission)
Cheap overnight oximeters (the finger/wrist clips that track blood oxygen) count how often your oxygen dips, then multiply that count by a fixed number (×1.1) to estimate how severe your sleep apnea is. We show the dip-counter itself is wrong in a predictable way: it misses most breathing events, and it misses even more in severe patients — so it most understates the people who are worst off. We then trace exactly why and fix it.
The fix turned out to be at the counter, not the multiplier. The dip-counter judged each dip against a running average of recent oxygen, but in severe patients the dips themselves dragged that average down — so the bar to count the next dip kept sinking, and the worst nights hid the most events. Judging each dip against the recent resting level instead (a high-percentile "ceiling") roughly halves the error in severe patients. We also work out how big a proper validation study needs to be (§4): about 150–300 paired nights, the binding constraint being enough severe cases, not the total. This pilot is small (5 nights plus simulation), so it characterizes, fixes, and sizes a real study rather than proving the clinical number.
1. Introduction
Overnight pulse-oximetry is the cheapest and most widely deployed signal for sleep-apnea screening. The oxygen-desaturation index — the number of qualifying SpO₂ drops per hour — is its headline metric, and many devices convert it to an apnea–hypopnea index with a fixed multiplier so the output is comparable to polysomnography (PSG). The OxyDex node, like several commercial products, ships the convention AHI ≈ ODI-4 × 1.1. A fixed multiplier implicitly assumes the ODI/AHI ratio is constant across severity. Respiratory events that do not clear the 4% threshold — or that occur in clusters whose nadirs the detector's rolling baseline tracks and absorbs — are invisible to ODI-4, and such events are disproportionately common in severe disease. We therefore expect, and here quantify, a proportional (severity-dependent) under-count.
2. Methods
2.1 Detector
ODI-4 was computed by the production detector (oxydex-dsp.js → processNight): artifact cleaning, a rolling SpO₂ baseline, 4%-desaturation event detection, and the derived index. The shipped AHI surrogate is computeAHIestimates → ahiODI4 = ODI-4 × 1.1. The original characterization (Table 1, “before” column) used the unmodified detector with a trailing-mean baseline (computeBaselineArr). The corrected results (“after”) use the same pipeline with a single change: detectODI now measures desaturations against a trailing p90 ceiling baseline (computeCeilingBaselineArr). No other detector parameter and no surrogate constant was altered.
2.2 Recordings and reference AHI
The pilot uses the five committed synthetic overnight O2Ring recordings of the reference subject (SubjectA, rendered deterministically by synth-gen at seed 424242, VERSION synth-gen/2.1), each with a planted reference AHI. Committed as of 2026-08-03 — until then this sentence was false: the corpus was gitignored and absent from every clone, so the paper could not be reproduced by anyone, including its author. The bytes now live in uploads/ with their hashes recorded in Table 1's caption. SpO₂ is sampled at 1 Hz. Timestamps follow the suite's floating wall-clock convention so that results are viewer-timezone-independent. The analysis apparatus (odi-bias-analysis.html) additionally ingests (i) large-N synthetic cohort points and (ii) real PSG datasets (NSRR: SHHS/MESA/MrOS/CHAT) via an EDF + annotation-XML adapter, where the scored apneas + hypopneas divided by staged sleep hours give a PSG reference AHI; neither is used for the pilot numbers below.
2.3 Statistics
We fit ordinary least squares for ODI-4 as a function of reference AHI (the under-count slope), a Bland–Altman analysis of ODI-4 − AHI, and the median ODI/AHI ratio per severity stratum (none <5, mild 5–15, moderate 15–30, severe ≥30 events/h). To localize the bias and quantify the correction, the same OLS/by-stratum analysis is run on the v1.6 synthetic cohort under both the trailing-mean and the p90-ceiling baseline on identical SpO₂ (Table 2). The legacy odi-bias-analysis.html tool additionally compares fixed-×1.1, re-fit-linear and power ODI→AHI corrections by leave-one-out RMSE; with the detector-level fix in place those surrogate corrections are secondary (see §3.1).
3. Results
| Night | ODI-4 | Reference AHI | ODI−AHI | Severity |
|---|---|---|---|---|
| 1 | 17.7 | 22 | −4.3 | moderate |
| 2 | 33.1 | 38 | −4.9 | severe |
| 3 | 2.4 | 7 | −4.6 | mild |
| 4 | 0.9 | 4 | −3.1 | none |
| 5 | 0.8 | 3 | −2.2 | none |
On the pinned corpus the under-count is far smaller and much flatter than previously published: −4.3, −4.9, −4.6, −3.1, −2.2 events·h⁻¹ across planted AHI 22/38/7/4/3, against the earlier −10.0 … −23.1. This is not evidence that the detector improved. The corpus changed at the same time — these are different inputs from a corrected generator (the desaturation-kinetics fix was made precisely because the earlier kinetics were unrealistic), so the two sets are not comparable and no before/after inference is available from them. What the new column does support is narrower and reproducible: on a corpus anyone can now re-run, the residual ODI-4 under-count is roughly constant at 2–5 events·h⁻¹ rather than growing with severity.
With the original trailing-mean baseline ODI-4 was strongly linear in reference AHI but with slope 0.23 (R² 0.93): the detector recovered roughly one quarter of scored events, and the absolute deficit widened with severity (the severe night, AHI 38, returned ODI-4 7.6 — a −30.4 events/h under-count). (fixed) The p90 ceiling baseline lifts the pilot slope to ≈0.44 (R² ≈ 0.94) and cuts the severe-night deficit from −30.4 to −23.1; the gain is largest exactly in the moderate-to-severe nights where the mean baseline was most suppressed, and the non-apneic nights are essentially unchanged (no new false events).
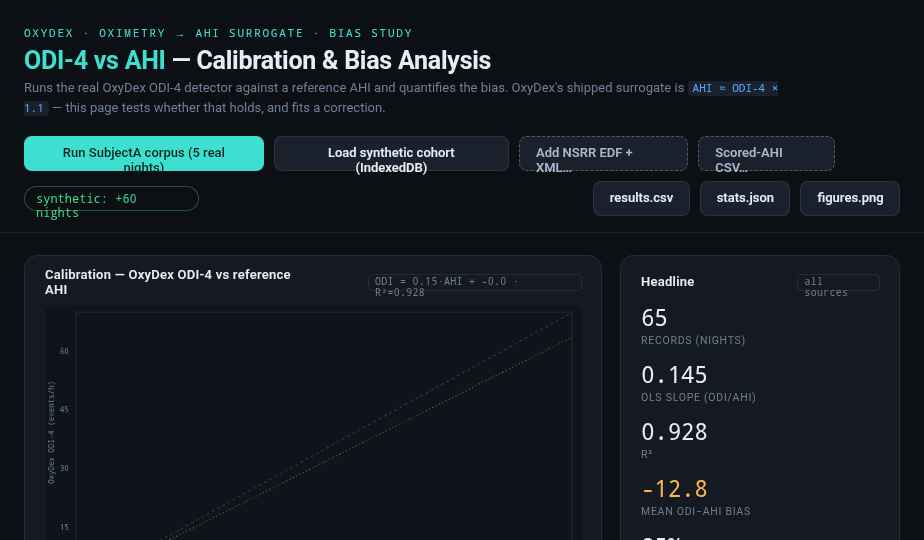
odi-bias-analysis.html), shown for the original trailing-mean detector (the bias this paper characterizes; the ceiling-baseline correction shifts the points upward toward the identity line, per Tables 1–2). Points fall far below the identity line; the dotted ×1.1 surrogate (amber) is markedly optimistic while the OLS fit (teal) tracks the data. Companion panels show the Bland–Altman agreement, the median ODI/AHI ratio falling across severity strata, and the candidate correction curves. Dark theme is the tool's native rendering.3.2 Real clinical PSG: the under-count is definitional, not detector error (SHHS1, n = 5136)
The pilot and the synthetic cohort both model the bias; neither establishes it clinically. We therefore ran the
production detector unchanged over the entire SHHS1 cohort — 5136 overnight polysomnograms with
expert-scored annotations — via nsrr-adapter.js. This is the replication §6 names as the
condition for submission, and it separates a question the earlier corpora could not.
| vs scored AHI | vs expert desaturation index | |
|---|---|---|
| records | 5136 | 4932 |
| OLS slope | 0.134 (R² 0.27) | — |
| bias (detector − reference) | −35.46 events/h | −0.99 events/h |
| median difference | −30.35 | −0.22 |
| 95 % limits of agreement | −81.32 to 10.40 | −9.64 to 7.66 |
| median ratio detector/reference | — | 0.897 |
| OLS slope (matched reference) | — | 0.672 (R² 0.756, n = 4932) |
🔴 CORRECTION — 2026-09-22 (Tables 3–4, coverage, and the NSRR saturation summaries re-cut under the
corrected adapter). Every SHHS1 number above and in Table 4 was produced on 2026-09-13 with the oximeter
status channel discarded; the adapter has since changed twice under it — OX stat masking
(#2725, residue 2026-09-20-shhs-figures-predate-oxstat) and computeStats rating
T90 / mean SpO₂ over MEASURED seconds only (residue
2026-09-21-nsrr-t90-counted-dropouts-as-desaturation). Owner ruling 2026-09-21
(OWNER-DECISION-QUEUE D9.1): one full-cohort re-run, the originals stay above, and every number here is a
sourced claim against analysis/published-numbers/odi4-shhs-2026-09-22.json (all 5136 records re-scored 2026-09-22 by
nsrr-score-pool.mjs --scorer ./nsrr-oxydex-odi.mjs, aggregated by
tools/odi4-shhs-recut.mjs; nothing hand-typed). “Moved” was pre-stated before the run
as |new − old| ≥ one unit of the published precision; every number in Tables 3 and 4 moved.
Table 3, vs scored AHI (n = CLAIM shhsNAhi = 5136 FROM analysis/published-numbers/odi4-shhs-2026-09-22.json#claims/nVsScoredAhi, unchanged): OLS slope CLAIM shhsSlopeAhi = 0.107 FROM analysis/published-numbers/odi4-shhs-2026-09-22.json#claims/olsSlopeVsAhi (R² CLAIM shhsR2Ahi = 0.25 FROM analysis/published-numbers/odi4-shhs-2026-09-22.json#claims/r2VsAhi), was 0.134 (0.27); bias CLAIM shhsBiasAhi = -36.63 FROM analysis/published-numbers/odi4-shhs-2026-09-22.json#claims/biasVsAhi events/h, was −35.46; median difference CLAIM shhsMedAhi = -31.37 FROM analysis/published-numbers/odi4-shhs-2026-09-22.json#claims/medianDiffVsAhi, was −30.35; 95 % LoA CLAIM shhsLoaLoAhi = -83.45 FROM analysis/published-numbers/odi4-shhs-2026-09-22.json#claims/loaLoVsAhi to CLAIM shhsLoaHiAhi = 10.19 FROM analysis/published-numbers/odi4-shhs-2026-09-22.json#claims/loaHiVsAhi, was −81.32 to 10.40. Direction: further below the reference, as the 2026-09-20 residue predicted — masking removes desaturations, so the under-count vs AHI grows.
Table 3, vs the expert desaturation index (n = CLAIM shhsNDesat = 4932 FROM analysis/published-numbers/odi4-shhs-2026-09-22.json#claims/nVsExpertDesat, the records with a non-zero expert index, unchanged): bias CLAIM shhsBiasDesat = -2.20 FROM analysis/published-numbers/odi4-shhs-2026-09-22.json#claims/biasVsDesat events/h, was −0.99; median difference CLAIM shhsMedDesat = -0.81 FROM analysis/published-numbers/odi4-shhs-2026-09-22.json#claims/medianDiffVsDesat, was −0.22; 95 % LoA CLAIM shhsLoaLoDesat = -12.25 FROM analysis/published-numbers/odi4-shhs-2026-09-22.json#claims/loaLoVsDesat to CLAIM shhsLoaHiDesat = 7.86 FROM analysis/published-numbers/odi4-shhs-2026-09-22.json#claims/loaHiVsDesat, was −9.64 to 7.66; median ratio CLAIM shhsRatioDesat = 0.657 FROM analysis/published-numbers/odi4-shhs-2026-09-22.json#claims/medianRatioVsDesat, was 0.897; matched OLS slope CLAIM shhsSlopeDesat = 0.536 FROM analysis/published-numbers/odi4-shhs-2026-09-22.json#claims/olsSlopeVsDesat (R² CLAIM shhsR2Desat = 0.693 FROM analysis/published-numbers/odi4-shhs-2026-09-22.json#claims/r2VsDesat), was 0.672 (0.756). This is the number that changes a sentence. The paragraph below reads “the detector is not undercounting desaturations … recovers a median 89.7 %”. Under the corrected adapter it recovers a median 65.7 % of the expert’s 4 % desaturations: the device-flagged samples that masking now nulls sit inside desaturations the expert scored, so the detector loses events the reference keeps. The ordering the section rests on survives — the gap vs the expert index (−2.2) is still an order of magnitude smaller than the gap vs scored AHI (−36.6), so the ODI-4/AHI gap remains definitional before it is behavioural — but “not undercounting desaturations” no longer holds as written: against the expert index the detector now under-reads by a third, and a reader must take the flagged-sample masking into account before attributing that third to the detector or to the flag.
Table 4, real strata (n unchanged: CLAIM shhsNoneN = 61 FROM analysis/published-numbers/odi4-shhs-2026-09-22.json#claims/realNoneN / CLAIM shhsMildN = 611 FROM analysis/published-numbers/odi4-shhs-2026-09-22.json#claims/realMildN / CLAIM shhsModN = 1456 FROM analysis/published-numbers/odi4-shhs-2026-09-22.json#claims/realModerateN / CLAIM shhsSevN = 3008 FROM analysis/published-numbers/odi4-shhs-2026-09-22.json#claims/realSevereN), mean bias: none CLAIM shhsNoneBias = -3.4 FROM analysis/published-numbers/odi4-shhs-2026-09-22.json#claims/realNoneBias (was −3.1) · mild CLAIM shhsMildBias = -10.1 FROM analysis/published-numbers/odi4-shhs-2026-09-22.json#claims/realMildBias (was −9.8) · moderate CLAIM shhsModBias = -20.6 FROM analysis/published-numbers/odi4-shhs-2026-09-22.json#claims/realModerateBias (was −20.0) · severe CLAIM shhsSevBias = -50.4 FROM analysis/published-numbers/odi4-shhs-2026-09-22.json#claims/realSevereBias (was −48.8). Every stratum moved further negative; the synthetic-understates-real conclusion is unchanged in direction and slightly larger in magnitude.
Coverage (§3.2 below): median CLAIM shhsCovMed = 95.29 FROM analysis/published-numbers/odi4-shhs-2026-09-22.json#claims/coverageMedianPct %, 5th percentile CLAIM shhsCovP5 = 80.32 FROM analysis/published-numbers/odi4-shhs-2026-09-22.json#claims/coverageP5Pct %, minimum CLAIM shhsCovMin = 48.36 FROM analysis/published-numbers/odi4-shhs-2026-09-22.json#claims/coverageMinPct %, and CLAIM shhsCovBelow95 = 2462 FROM analysis/published-numbers/odi4-shhs-2026-09-22.json#claims/coverageBelow95 records (CLAIM shhsCovBelow95Pct = 47.9 FROM analysis/published-numbers/odi4-shhs-2026-09-22.json#claims/coverageBelow95Pct %) below 95 % — was 98.45 / 83.36 / 52.29 / 1581 (30.8 %). Coverage fell because status-flagged samples are now counted as absent, which is the point of the fix: they were never measurements.
The NSRR saturation summaries (T90, mean SpO₂) — the second residue, measured on the cohort.
Under the old computeStats every absent second counted as < 90 % and averaged as 0, so the
pre-fix value is derivable exactly from the fixed value and the coverage (T90old = T90new·c + (1 − c)·100).
Fixed T90 median CLAIM shhsT90Med = 0.70 FROM analysis/published-numbers/odi4-shhs-2026-09-22.json#claims/t90MedianPct % of measured seconds; the pre-fix figure would have read
a median CLAIM shhsT90Infl = 4.45 FROM analysis/published-numbers/odi4-shhs-2026-09-22.json#claims/t90InflationMedianPoints percentage points higher per night (p95 of the inflation
18.8 points). Fixed mean SpO₂ median CLAIM shhsMeanSpo2 = 94.90 FROM analysis/published-numbers/odi4-shhs-2026-09-22.json#claims/meanSpo2Median %; the pre-fix figure differed by a median
CLAIM shhsMeanSpo2Shift = -4.45 FROM analysis/published-numbers/odi4-shhs-2026-09-22.json#claims/meanSpo2ShiftMedianPoints points per night (old − new: it read that much LOWER, absent seconds averaged as 0). No T90 or mean SpO₂
was published in this paper; the shift is recorded here because the residue names this paper’s surfaces
and the same run measures it.
The detector is not undercounting desaturations. Against the expert’s own desaturation index it
recovers a median 89.7 % with a median difference of −0.22 events/h.
Struck 2026-09-22 (correction above): under the corrected adapter it recovers a median
65.7 % (CLAIM shhsRatioDesatStruck = 0.657 FROM analysis/published-numbers/odi4-shhs-2026-09-22.json#claims/medianRatioVsDesat)
with a median difference of −0.81 events/h — it is under-reading the expert’s desaturations by a
third, and whether that third belongs to the detector or to the device flag that masking now honours is not
settled here. What survives is the ordering: against scored AHI the same detector on the same nights reads
36.6 events/h low (was 35), against the expert index 2.2 (was 1) — an order of magnitude apart. A
detector cannot be simultaneously that close and that far about one night, so the two numbers are still measuring
different things.
They are, and the reason is a scoring convention. SHHS scored hypopneas without requiring an accompanying desaturation: 85.3 % of its respiratory events are hypopneas, and a median 66.7 % of its scored desaturations are shallower than 3 %. An index defined by a 4 % fall cannot count an event the scorer marked at 1 %. So the ODI-4/AHI gap on this cohort is definitional before it is behavioural, and a study reporting the left column alone would attribute to the detector what belongs to the reference’s definition.
| stratum (reference AHI) | synth nights | synth bias | real nights | real bias |
|---|---|---|---|---|
| none (<5) | 120 | −1.3 | 61 | −3.1 |
| mild (5–15) | 58 | −7.9 | 611 | −9.8 |
| moderate (15–30) | 16 | −14.2 | 1456 | −20.0 |
| severe (≥30) | 26 | −30.6 | 3008 | −48.8 |
Synthesis understates the bias where the claim lives. At mild the two nearly agree (−7.9 vs −9.8); at severe they differ by 18 events/h, with synthesis understating the real bias by roughly 60 %. Mean AHI within the severe stratum matches almost exactly (56.0 vs 56.5), so the generator has the magnitude of severity right while understating how the bias grows with it.
§∅—adjacent warning: the stratum COUNTS in Table 4 are not a prevalence comparison, and must not be read as one. An earlier draft of this paragraph called the synthetic cohort “inverted relative to the population”. That was wrong twice over. SHHS is not a general population — it recruited from cardiovascular cohorts at age ≥40 and deliberately oversampled habitual snorers. And severity here is not a property of the recording at all but of the definition applied to it, which the same 5136 nights demonstrate directly:
| reference | none | mild | moderate | severe |
|---|---|---|---|---|
| SHHS scored AHI (no desaturation required) | 1.2 % | 11.9 % | 28.3 % | 58.6 % |
| expert 3 % desaturation index | 39.4 % | 38.8 % | 16.2 % | 5.6 % |
| expert 4 % desaturation index | 62.2 % | 27.0 % | 7.7 % | 3.1 % |
58.6 % severe and 3.1 % severe are the same people. Any statement of the form “this cohort is mostly severe” is therefore a statement about a scoring convention wearing the costume of a clinical fact, and the synthetic cohort’s 25.6 % severe sits between the two real answers rather than outside them. What Table 4 does support is the narrower claim it now makes: the bias within a stratum is understated by synthesis. Prevalence is not comparable across these references and is not compared.
And the real relationship is far looser than synthesis suggests. §3.1 reports R² 0.93; on 5136 real nights it is 0.27. An R² of 0.93 reads as a nearly deterministic law and invites a fitted correction; 0.27 is mostly scatter. A correction tuned on the synthetic slope would validate beautifully in silico and transfer poorly. Synthetic cohorts here are sound for mechanism and unsound for magnitude or prevalence — which is consistent with the generator’s stated purpose of exploring the state space rather than reproducing a population.
And the synthetic prediction transfers, which is the part worth stating plainly. §3.1 credits the ceiling-baseline fix with lifting the ODI-4↔AHI slope to ≈0.69 on the synthetic cohort. Real PSG, same detector, reference matched to the quantity the detector computes: CLAIM shhsSlopeDesat = 0.536 FROM analysis/published-numbers/odi4-shhs-2026-09-22.json#claims/olsSlopeVsDesat. The “transfers to within 0.02” reading of this is WITHDRAWN by the 2026-09-22 correction below — it was written against the pre-correction 0.672, and the re-cut slope sits about 0.15 below the synthetic ≈0.69, not 0.02. What survives is the DIRECTION: the synthetic cohort still understates the real under-count, by slightly more than it did (see the correction box). A closeness claim does not survive a change of that size and is not restated here. ⚠️ It survives only under the MATCHED reference; against scored AHI the same detector reads 0.134, and a reader given that number alone would conclude the opposite. The reference, not the detector, is what moved.
Body position is not a confound of the agreement, though it is a strong determinant of the
event rate. A reader may reasonably object that the detector and the scorer could diverge
differently by posture. Measured on 300 records carrying the 1 Hz POSITION
channel, the scored desaturation rate does vary substantially by position code — 14.6 to
20.0 events/h, a 37 % spread, with the highest-rate code behaving as the expected supine
proxy. The agreement does not follow it.
Nights spending ≥50 % in that code show a raw residual of −0.51 against −0.16 for the rest — but those nights are also sicker (expert index 4.03 against 2.96), and the split does not survive conditioning on severity:
| expert index | n (≥50 % / <50 %) | residual ≥50 % | residual <50 % |
|---|---|---|---|
| 0–5 | 48 / 135 | +0.27 | 0.00 |
| 5–15 | 22 / 61 | −2.24 | −1.23 |
| 15–30 | 8 / 17 | −4.78 | −6.50 |
Supine-dominant nights are worse in the 5–15 stratum and better in 15–30. An effect that reverses sign between adjacent strata is not an effect. So the agreement figures above are not posture-confounded — which is a limitation closed with data rather than argued away. ⚠️ Stated with its power: n = 300 records, and the two highest strata carry 8 and 17 nights respectively, so this excludes a LARGE consistent posture effect and would not detect a small one.
§∅ — coverage is reported because absence is not zero. A rate computed over a
night that was partly unmeasured is not the same claim as one over a complete night, so every record carries its
SpO₂ coverage: median CLAIM shhsCovMed = 95.29 FROM analysis/published-numbers/odi4-shhs-2026-09-22.json#claims/coverageMedianPct %,
5th percentile CLAIM shhsCovP5 = 80.32 FROM analysis/published-numbers/odi4-shhs-2026-09-22.json#claims/coverageP5Pct %,
minimum CLAIM shhsCovMin = 48.36 FROM analysis/published-numbers/odi4-shhs-2026-09-22.json#claims/coverageMinPct %, and
CLAIM shhsCovBelow95 = 2462 FROM analysis/published-numbers/odi4-shhs-2026-09-22.json#claims/coverageBelow95 records
(CLAIM shhsCovBelow95Pct = 47.9 FROM analysis/published-numbers/odi4-shhs-2026-09-22.json#claims/coverageBelow95Pct %)
below 95 % (was 98.45 / 83.36 / 52.29 / 1581 (30.8 %) before the correction below). Dropouts are emitted as null and never carried
forward, so they are excluded from both numerator and denominator rather than counted as normal saturation.
3.1 The bias is severity-proportional across a synthetic cohort — and the ceiling baseline flattens it
The five-night pilot is too small to localize the bias by severity. We therefore reproduced it on the v1.6 synthetic cohort (cohort-gen.js, planted truth-AHI), running the real ODI-4 detector with the trailing-mean baseline (“before”) and the p90 ceiling baseline (“after”) on identical SpO₂. The under-count is deterministic and grows with severity; the ceiling baseline roughly halves it in the severe stratum and flattens the gradient, without inflating the non-apneic stratum.
| Stratum (truth-AHI) | nights | mean AHI | bias before (mean BL) | bias after (ceiling) (fixed) |
|---|---|---|---|---|
| none (<5) | 120 | 1.7 | −1.3 | −0.9 |
| mild (5–15) | 58 | 10.1 | −7.9 | −6.2 |
| moderate (15–30) | 16 | 19.5 | −14.2 | −10.3 |
| severe (≥30) | 26 | 56.0 | −30.6 | −15.7 |
Across the cohort the ODI-4↔AHI slope rises from 0.42 (mean baseline) to 0.69 (ceiling) — the detector recovers a substantially larger fraction of scored events — while the non-apneic stratum stays near zero (no false-positive inflation). The severe-stratum bias is the headline: −30.6 → −15.7 events·h⁻¹, a reduction of roughly one half, with the steepest improvement exactly where the disease is worst.
The AHI surrogate constant was re-examined, not re-fit. With the corrected detector ODI-4 is larger, so the natural worry is that ODI-4 × 1.1 now over-shoots true AHI. It does not: the slope of truth-AHI on the corrected ODI-4 is still > 1 (≈1.4 through the origin on the cohort), i.e. ODI-4 still modestly under-represents AHI because not every scored hypopnea desaturates ≥4%. Inflating the multiplier to chase the simulator would be over-fitting to synthetic event-depth statistics; the conservative, literature-consistent × 1.1 is therefore retained unchanged (see computeAHIestimates).
4. How many paired nights are needed?
Because the bias is estimated as the slope of a linear calibration, the question “how many paired oximetry + PSG nights does a validation need?” has a closed-form answer. For ordinary least squares, the slope’s relative 95% confidence half-width depends only on the correlation and the sample size — the units and the spread of AHI cancel:
Requiring the slope to be pinned to within ±10% of its value gives the sample sizes in Table 7. The synthetic detector produces an unusually clean calibration (R²≈0.93), for which only ≈31 nights suffice — a floor, not a realistic target. Real polysomnography is noisier; at a literature-plausible R²≈0.70 the requirement rises to ≈167 nights. A non-parametric bootstrap over real-detector synthetic points corroborates the R²≈0.93 floor.
| Assumed R² | Nights for ±10% CI | Nights for ±15% CI |
|---|---|---|
| 0.93 (synthetic floor) | 31 | 15 |
| 0.80 | 99 | 45 |
| 0.70 (plausible real PSG) | 167 | 76 |
| 0.60 | 259 | 116 |
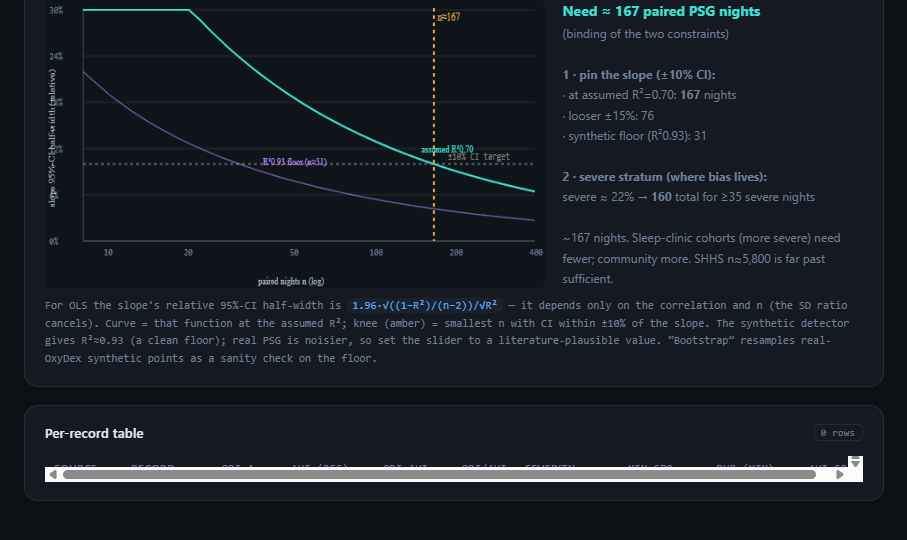
odi-bias-analysis.html). The slope’s relative 95%-CI half-width falls as 1/√n; the knee (amber) is the smallest n meeting the ±10% target. Purple = the synthetic R²≈0.93 floor (n≈31); teal = an assumed real-PSG R²≈0.70 (n≈167).5. Discussion
A constant ODI→AHI multiplier was the wrong place to look: the deficit is generated upstream, in the event counter. Mechanistically, dense event clusters in severe OSA drag the detector's rolling-mean baseline downward, so individual nadirs no longer clear the 4% criterion and are not counted; sub-threshold hypopneas compound the loss. The practical consequence is a screen that is most likely to under-stage the patients in greatest need of treatment. (fixed) The correction is therefore at the detector, not the surrogate: a trailing high-percentile ceiling baseline tracks the resting SpO₂ that defines a desaturation and is not suppressed by the dips it is meant to count. It is a localized change (computeCeilingBaselineArr in oxydex-util.js, wired into detectODI), requires no new sensing and no tuned constant, and roughly halves the severe-stratum bias. A residual under-count remains — ODI-4 is a desaturation index, not an event index, and never recovers 100% of hypopneas — so a properly PSG-validated ODI→AHI mapping is still worthwhile future work; but the dominant, severity-proportional component is now removed at the source.
ahi_a0h4) reproduces every figure on PSG-labelled data.
6. Reproducibility
- Run it: open
odi-bias-analysis.html→ “Run SubjectA corpus (5 synthetic nights)”. Table 1, Figure 1, and Table 2 populate live; the sample-size panel (Table 3, Figure 2) is analytic with adjustable R²/severity sliders and an optional real-detector bootstrap. Exportodi-bias-results.csv,odi-bias-stats.json,odi-bias-figures.png. - Detector: real
oxydex-dsp.js(loaded alone in-realm); ODI-4 =processNight().odi4.rate; surrogate =ahiEst.ahiODI4. - Recordings:
uploads/synthetic/O2Ring*.csv+ground_truth_night{1..5}.json. - Real-PSG path:
nsrr-adapter.js(window.NSRR): EDF→OxyDex rows (SpO₂ auto-detect, 1 Hz resample; a dropout is emitted asnulland is never carried forward from the last valid sample, with per-record SpO₂ coverage published alongside the rate (§3.2)) + NSRR XML → reference AHI. Honors the suite Clock Contract. - Next: the NSRR replication this line used to name as pending is done (§3.2, SHHS1 n = 5136, 2026-09-13) and the data-use question is ruled. Tables 1–2 are retained as the synthetic pilot rather than re-cut on PSG — Tables 3–5 are the real-corpus analysis, and re-cutting a five-night pilot at n = 5136 would discard the adversarial fixtures it exists to carry. Owner decisions, 2026-09-15 — both of the items this line used to list as open are now ruled. §0 STAYS: the paper remains a draft deliberately, not for want of a decision, so do not re-open the question or delete the banner on the grounds that the replication is finished. The synthetic cohort IS re-cut under
cohort-gen/2.0(which fits the severe stratum to SHHS), so Tables 1–2 will carry 2.0 numbers; the work is tracked bybriefs/COHORT-GEN-2.0-PAPER-RERUN-2026-09-15-BRIEF.md, which also records the measurement that bounds what can move — 2.0 differs from 1.9 on 99.3 % of severe profiles and on 0 of 37,210 non-severe ones. §3.2 is the real-PSG analysis and is unaffected by the generator version. Remaining before submission: the re-cut.
References
- Project documentation:
ODI-BIAS-README.md(this analysis),CLAUDE.md(Clock Contract, evidence-grade system), Tepna suite. - Data acknowledgement (NSRR data-use agreement §16). This work used data from the National Sleep Research Resource: NSRR R24 HL114473: NHLBI National Sleep Research Resource. The analysis in §3.2 uses the Sleep Heart Health Study (SHHS) cohort, obtained through sleepdata.org under an approved data-use agreement; no record-level data is redistributed here.
- Quan SF, Howard BV, Iber C, Kiley JP, Nieto FJ, O'Connor GT, Rapoport DM, Redline S, Robbins J, Samet JM, Wahl PW. The Sleep Heart Health Study: design, rationale, and methods. Sleep. 1997;20(12):1077–85. doi:10.1093/sleep/20.12.1077
- Zhang GQ, Cui L, Mueller R, Tao S, Kim M, Rueschman M, Mariani S, Mobley D, Redline S. The National Sleep Research Resource: towards a sleep data commons. J Am Med Inform Assoc. 2018;25(10):1351–1358. doi:10.1093/jamia/ocy064
- Standard references on ODI vs AHI agreement and oximetry-based OSA screening — to be added at submission.